
Summary
The snow- and groundwater level at the end of March was at the highest level for the last 20 years, with 64 TWh which is 22 TWh above the normal or 150% of normal.
The water reservoir filling is also still significantly higher than the normal after the extreme inflows throughout January and February: The filling rate of 42% at the end of March, is 5 TWh above the normal.
In the blog post published on 9 March, we concluded that we would most likely see filled hydro reservoirs by the end of August, and spilt water outside the power plant installations. The scenario by the start of April is that we expect the hydro reservoirs to be completely filled mid-July.
We expect 8-10 TWh water spillage by normal weather conditions.
Precipitation and snow package
The Norwegian hydrological balance grew remarkably during January and February when the energy precipitation came out at twice the normal,
which means 23 TWh above the normal.
This wet scenario continued as March came out at 150 % of normal (+5 TWh). Current weather outlooks for April, however, shows that a drier period during and after Easter seems most likely.
Our precipitation models have been somewhat adjusted upwards for NO2 and NO5, the westernmost price zones, in total by about 2 TWh since December based on precipitation observations across the country. No adjustments were made for the other price zones.

The snow- and groundwater level at the end of March is about 64 TWh, which is 22 TWh above the normal (+50 %). The precipitation table below shows that we have seen more precipitation at 170%-200% of normal in all price zones except NO1.

Precipitation in Q1-2020 is by far the highest we have seen the last 20 years: Nearly 28 TWh above the normal. Until today, the highest precipitation for Q1 the previous 20 years was 50 TWh (2000 and 2008).
So this Q1 is really extreme, beating the former 20-year precipitation record by 20%! The snow/groundwater level this year is a new 20-year record too.
For more details, see https://app.energyquantified.com/hydrology/nominal/no (login required, but you can create an account here).
Outlooks for hydro reservoirs this summer
Starting at the end of week 15 (on Easter day).
We have updated the power balance and hydrological models to estimate the hydropower production, inflows and the according to hydro reservoir development. We assume that maximum filling in Norway is restricted to be about 96% (83 TWh) when taking into account skewness in filling rates between price zones.

Max hydropower production weeks 16-35 has so far been about 50 TWh, so this record has to be beaten by 20% in order to avoid water spillage. It doesn’t seem realistic.
From models on a weekly resolution, we have made the following calculations of hydropower, export balance and reservoir level:
The export assumption is based on observations from the wet years since 2010 (2012, 2015, 2016, 2017). We see about 3000 MW as a max potential export level during Q2 and Q3, see chart.

When estimating the hydropower production, we do not assume reduced consumption in Norway due to coronavirus as we believe reductions will be rather marginal and do not influence this simplified calculation.
The weekly hydropower calculation shows that at a 3000 MW export level, the hydropower for 2020 will follow earlier max-levels during Q2-Q3.
Notice the low levels during Q1-2020 caused by:
- Mild weather
- Troublesome export due to strong wind power in Germany, Sweden and Denmark
- Reduced export capacity to Sweden for a while

The hydropower production for weeks 16-35 is calculated to be about 50 TWh (114 % of normal). This is 9 TWh less than needed to avoid water spillage (see aggregated model above).
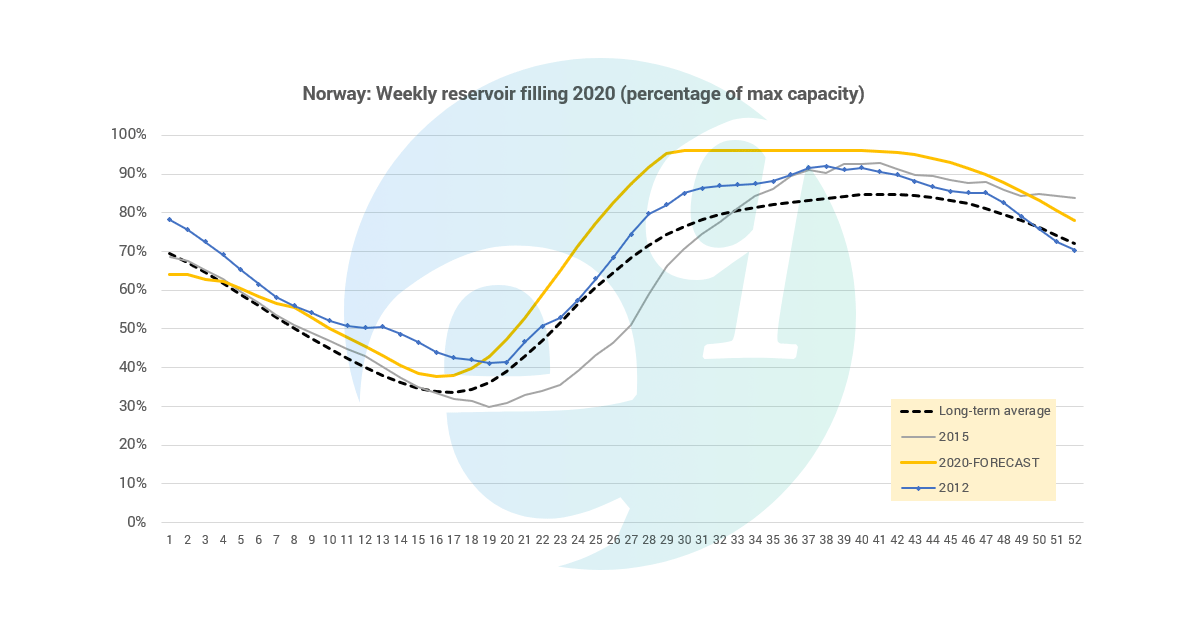
See the reservoir profile for 2020 in the chart below. The wet years 2012 and 2015 are included in the chart for comparison.

We expect to reach max capacity of 96% already by mid-July (week 29). Expected water spillage is about 9 TWh by normal precipitation conditions.
The precipitation uncertainty based on 20 years is about ±8 TWh from mid-April to mid-July. 2018 was the driest year during this period, which means that in a 2018 climatic scenario we might avoid water spillage. This is an overall and aggregated view. There will be regional differences and probably filled reservoirs in several regions even in the driest scenarios.
Flooding risk
On 30 March, the Norwegian water and electricity authorities (NVE) published a spring inflow analysis which concluded that there was a high flooding risk in many watercourses this year.
Water spillage outside the power plants will in many cases be a result, but this spring spillage will probably not reduce the reservoir filling significantly. It’s mainly river plants that will see water spillage during May and early June. The huge water spillage volumes will be seen from the start of July when the reservoirs have been filled up.
We will most likely see controlled water spillage from reservoirs during Q3 to avoid strong flooding risk during late summer and early autumn.
Conclusion
2020 looks like to be a new record year for hydropower production in Norway.
Outlooks for the summer show maximum filling levels in reservoirs by mid-July. Normal precipitation during Q2 will result in significant water spillage. Precautions to avoid strong flooding risk during Q3 will most likely have to be done.
For the power market, we assume suppressed prices until the end of August at least.
EQ will follow this extreme situation during the summer and keep you posted.


