

DISCLAIMER: The negative consumption effect stems from authorities measures to curb the Corona pandemic. EQ’s consumption systems allow us to measure and quantify the impact as new actual data arrives. We do not claim to know when or how the authorities will lift the current business quarantine. In this blog post, we simulate and quantify the energy and load effect of some alternative paths back to normal.
Current situation
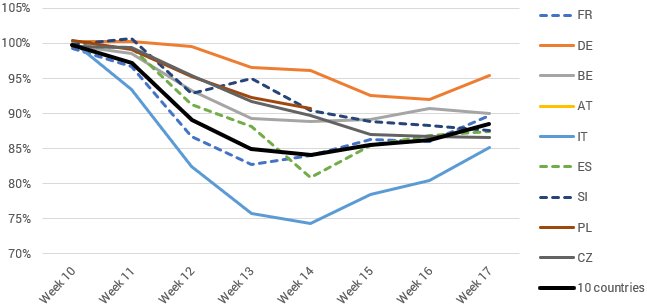
On 19 March, EQ published a blog post about the falling electricity consumption due to Coronavirus across Europe. We followed ten countries from week 10 (Monday 2 March), and we have now updated the numbers until end week 17.
The consumption reduction has more or less leveled out by Easter (week 15). We observe the beginning of a recovery phase in countries like Italy, France and Spain, which have suffered most from the pandemic. These countries introduced the hardest lockdowns which have, to some extent, been easing after Easter.
The near future is uncertain, both for how to combat the Coronavirus epidemic and for the economic outlook. EQ has studied consumption development so far and simulates some scenarios to show possible paths of recovery towards New Year. EQ does not believe that the European markets will reach the normal curve by New Year in any of the presented scenarios.
Base scenarios
We see similarities between some countries. Thus we have made three categories of countries/areas:
- France/Italy/Spain: These countries have had 18%-19% reduction before Easter, and seem to follow a kind of parallel development.
- Nordic region: An approximately 3% reduction. No significant percentage difference between these four countries so far.
- Other countries in Western Europe: In most cases, being close to 10% reduction, they seem to follow each other quite carefully.
For these three categories, we generated weighted %-average reduction curves, actual until week 17 and a suggested base scenario for further development until the end of 2020.
The dotted yellow line indicates the weighted %-reduction across all Western Europe, 15 countries consuming 2516 TWh/year – the normal for 2020 before the Coronavirus epidemic.
We believe that measures from the authorities will mainly determine the recovery-profile towards the start of Q4-2020. Towards New Year, we believe that the economic reality will mean more for the development as the infection hopefully will be less severe.
We also believe that the strong recovery we have seen from week 13/14 will be somewhat dampened the next few months, as the measures to combat the Corona-infection will still be in place across Europe.
When estimating the level by New Year, we have an assumption of about 4 % reduced consumption for France/Italy/Spain (Category 1 – weighted) by New Year. Meaning, we suggest that consumption levels by the end of 2021 will reach to recover to the original 2020. The other categories are simulated proportional to Category 1 as a simplification with so much uncertainty.
We estimate furthermore that the weighted average curve for Western Europe (15 countries) will by the end of 2020 show reduced consumption of about 3 %. By week 13/14 the weighted reduction across Western Europe was about 11%, which was nearly 35 000 MW accumulated. The rapid fall from week 10 has been exceptional in all ways, and we see a recovery trend towards 10 000 MW reduction by New Year (3% reduction).

We have estimated the TWh-reduction for 2020 in total for these three categories:

The Nordic reduction is meager based on the observed consumption-reaction so far. The rest of Europe shows a Coronavirus-reduction which is similar to the losses we saw during the financial crises of 6% reduction in 2009. This swift downward reaction during March (week 10-14) is however exceptional.
Recovery scenarios
EQ has made two more scenarios to indicate possible recovery profiles across Europe towards New Year. These scenarios are made for the weighted West European average (Category 1–3).
Fast-recovery scenario. Based on a recovery profile that continues on the recovery trend seen after Easter and assumes more easing of Corona-measures. That means a very positive development of the infection across Europe, but can not be ignored as a scenario. Fast recovery also means that the consumption loss towards New Year is somewhat limited, see the chart below.
Slow-recovery scenario. Opposite to the fast-recovery scenario. Measures are easing slower as the infection across Europe is not dampened that much. Thus the economic consequences hit harder, and consumption declines stronger.
The charts shows that the slow-recovery scenario indicates 10.000 more consumption losses at end of 2020 than in the fast-recovery scenario.
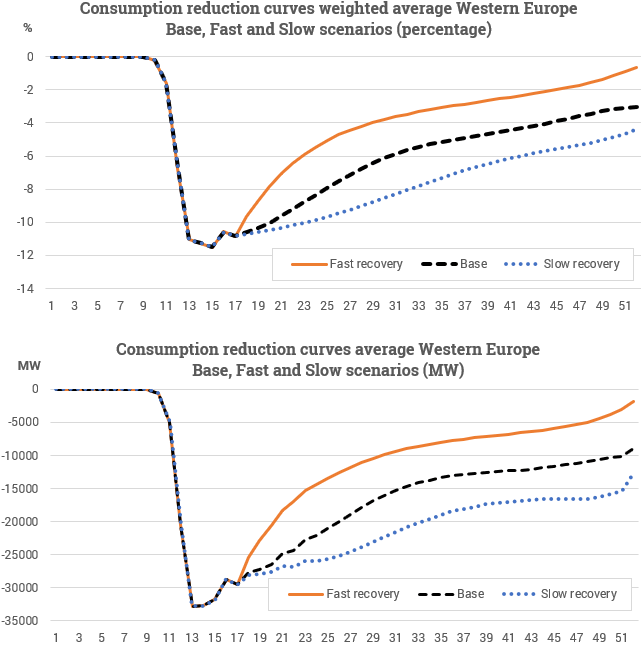
See table for how much the differences in scenarios mean for total consumption reduction 2020. Given our proposals, we could see a 4% - 6% consumption reduction. That is not so different from what we saw during the financial crisis in 2009.

Final words
The consumption across Europe dived sharply during March and started its recovery in April. The outlooks identified by the three scenarios Fast, Base and Slow Recovery are, of course, very uncertain. Every day we get more information on how the electricity market as a whole will develop during this recovery phase we now undergoing.
EQ continues to follow-up on the development and will publish more blog posts to keep our customers updated. Don't hesitate to contact us if you have any questions regarding consumption development or other related issues.


